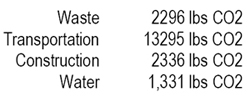
As previously explained, the CO2 emissions due to waste, transportation and construction were kept constant in the buildings in the four climates and are presented in Table 5. Keeping these values as fixed variables makes it easier to determine the relationship between operational CO2 emissions and the effect of climate on these variables.
Two programs, HEED and Design Builder, were used to calculate energy use in the four locations. HEED (Home Energy Efficient Design) (11) is an energy analysis tool that shows designers the building’s performance at every step of the way. When HEED is first launched it asks four questions about the project (building type, square footage, number of stories, and climate location). With this information it creates Scheme 1, a building that meets the California Energy Code. It then designs a second Scheme that is usually about 30% better. Next it suggests other strategies that designers can test using the remaining seven schemes. HEED makes it very easy for users to change any aspect of the building’s design. After each design change HEED shows how the building’s performance compares with the initial schemes.
DesignBuilder is a user interface to the EnergyPlus dynamic thermal simulation engine. DesignBuilder features an OpenGL solid modeler, which allows building models to be assembled by positioning, stretching and cutting 'blocks' in 3-D space. 3-D elements provide visual feedback of actual element thickness and room areas and volumes. Data templates allow to load common building constructions, activities, HVAC & lighting systems into the design by selecting from drop-down lists. These templates can also be added. The user can switch between Model Edit View and Environmental performance data which is displayed without the need to run external modules and import data.
If vehicular transportation is considered, the emissions due to operational energy and transportation are the most significant, about 41% each (Fig. 9).
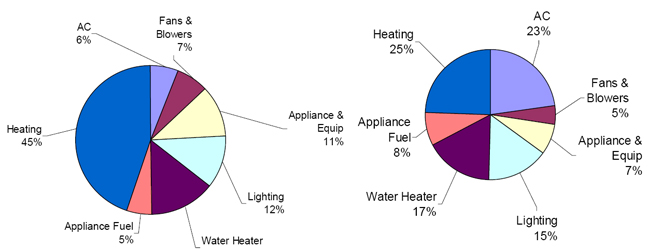
Figure 10: Operational Emissions in a Cold Climate (Bishop, CA). Left chart obtained with HEED and right with Design Builder.
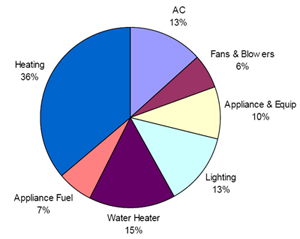
Figure 11: Operational Emissions in a Cold Climate (Bishop, CA). Average obtained using HEED and Design Builder.
To determine the impact of the different areas in operational energy a more detailed analysis (Fig 10, 11) was performed. This analysis included heating, AC, fans & blowers, appliances, water heaters, and lighting. It indicates that in the cold climate selected, according to both HEED and Design Builder, most of the emissions from operational energy are from heating, 45% according to HEED plus an additional 7% for fans and blowers, and 25% according to Design Builder plus an additional 5% for fans and blowers. Averaging results from both tools indicates that 36% of the emissions come from heating. A gas furnace with an AFUE of 80% was used. Design Builder indicates a need for more cooling during many mid season days than HEED to maintain indoor conditions in the comfort zone, which is probably the reason for the additional cooling energy indicated by that program.
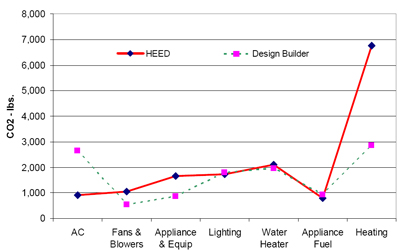
Figure 12: Operational Emissions in a Cold Climate (Bishop, CA), values with HEED and Design Builder.
5.2 Temperate Climate
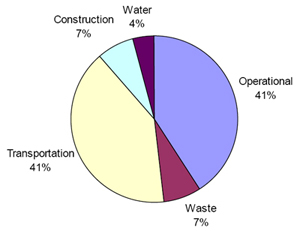
In the temperate climate the CO2 emissions from operational energy are a smaller portion of all emissions. Transportation becomes much more important, assuming the values previously used. Figure 15 shows how CO2 from transportation can be responsible for about half of all emissions in a temperate climate because of the reduction in emissions from operational energy due to the milder climate. Operational emissions can be reduced even more if appropriate design strategies are implemented.
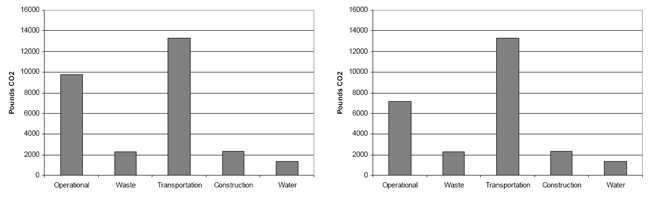
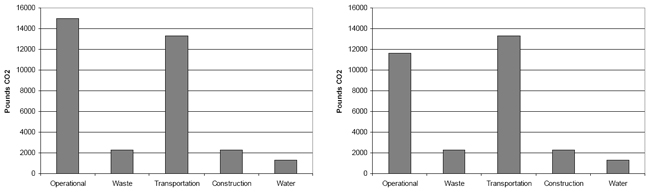
Figure 13: Quantitative distribution of Emissions in a temperate climate. HEED results are on the left and Design Builder on the right.
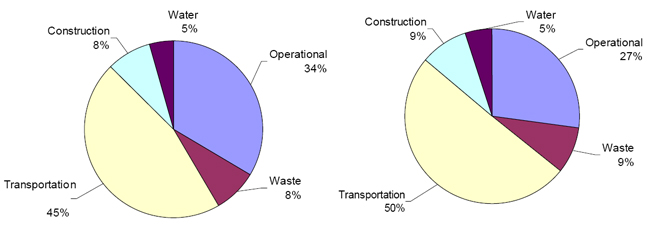
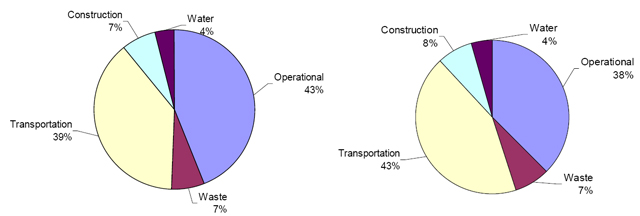
Figure 14: Distribution of Emissions in a Temperate Climate. HEED on the left and Design Builder on the right.
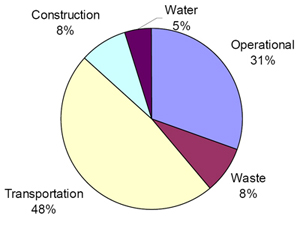
Figure 15: Distribution of Emissions in a Temperate Climate. Average of HEED and Design Builder.
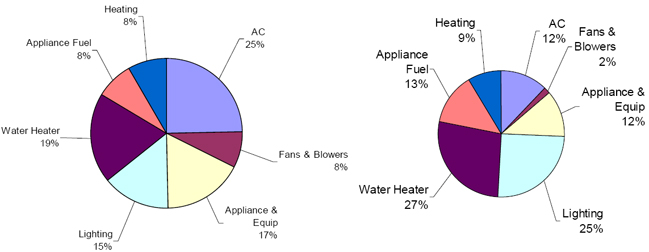
Figure 16: Operational Emissions in a Temperate Climate (Los Angeles, CA). Left with HEED and right with Design Builder.
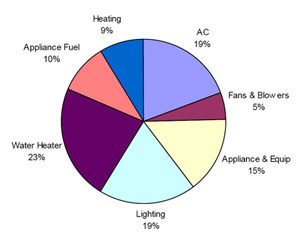
Figure 17: Operational Emissions in a Temperate Climate average from HEED and Design Builder.
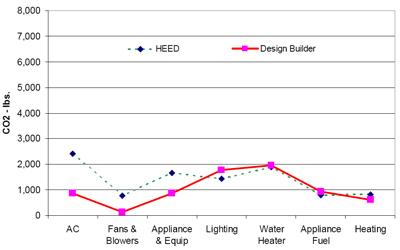
Figure 18: Operational Emissions in a Temperate Climate, values with HEED and Design Builder.
In the temperate climate the CO2 emissions from operational energy are 9,791 lbs/year of C02 as determined by HEED and 7,181 lbs/year by Design Builder (Fig 19). Analysis of the operational emissions indicates that the emissions from the different areas inside operational energy are more evenly distributed between all these sources (Figs 22 & 23). Since heating and cooling are not as critical because the climate is more moderate, water heating and lighting become more important components of operational energy emissions.
5.3 Hot and Dry Climate
For a hot and dry climate the CO2 due to operational energy is: 13,453 lbs of C02 for HEED and 12,098 lbs for Design Builder (Fig 19). These are a large portion of total emissions (40%).
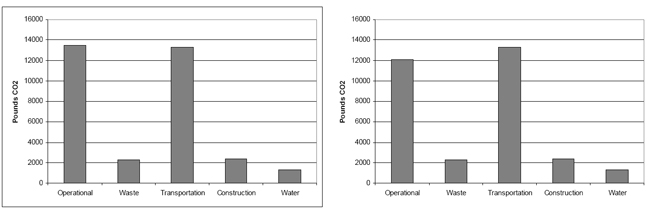
Figure 19: Quantitative distribution of Emissions in a Hot and Dry climate. HEED results are on the left and Design Builder on the right.
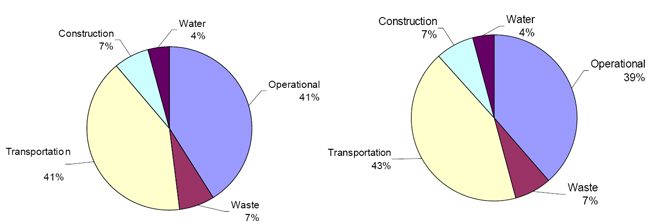
Figure 20: Distribution of Emissions in a Hot and Dry Climate. HEED on the left and Design Builder on the right.
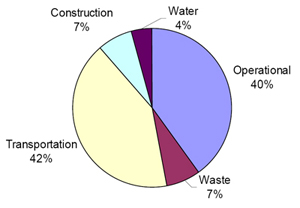
Figure 21: Distribution of Emissions in a Hot and Dry Climate. Average of HEED and Design Builder.
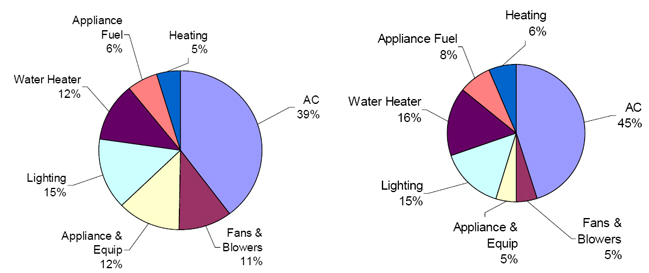
Figure 22a: Operational Emissions in a Hot and Dry Climate. Left with HEED and right with Design Builder.
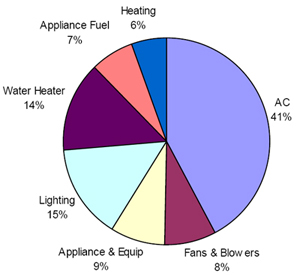
Figure 22b: Operational Emissions in a Hot and Dry Climate average from HEED and Design Builder.
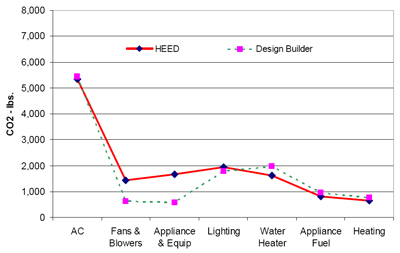
Figure 23: Operational Emissions in a Hot and Dry Climate, values with HEED and Design Builder.
A more detailed analysis of the operational emissions indicates that in a hot and dry climate most of these emissions (41%) are from cooling plus 11% for fans and blowers (Fig 23). There is close agreement between the results with HEED and Design Builder.
5.4 Hot and Humid Climate
In a hot and humid climate the CO2 emissions from operational energy are 11,528 lbs of CO2 as determined by HEED and 10,700 lbs of C02 (37% of total) as determined by Design Builder (36% of total). Operational emissions constitute 37% of the total building emissions when averaged.
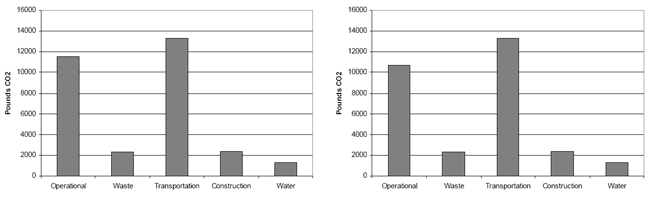
Figure 24: Quantitative distribution of Emissions in a Hot and Dry climate. HEED results are on the left and Design Builder on the right.
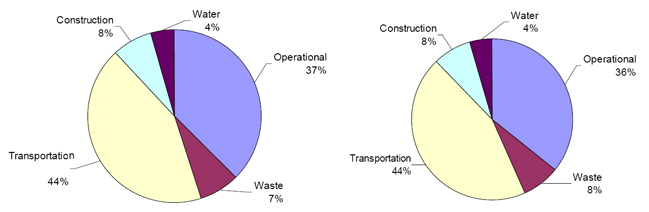
Figure 25: Distribution of Emissions in Hot & Humid Climate HEED results are on the left and Design Builder on the right.
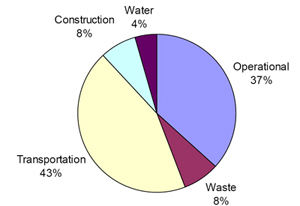
Figure 26: Distribution of Emissions in a Hot and Humid Climate. Average of HEED and Design Builder.
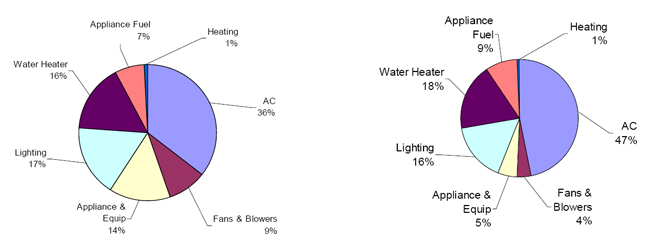
Figure 27: Operational Emissions in a Hot and Humid Climate. Left with HEED and right with Design Builder.
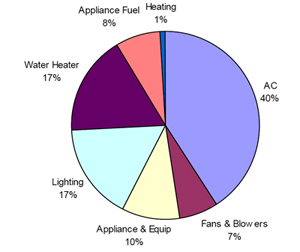
Figure 28: Operational Emissions in a Hot and Humid Climate. Average with HEED and Design Builder.
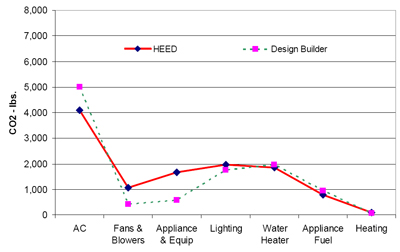
Figure 29: Operational Emissions in a Hot and Humid Climate, values with HEED and Design Builder.
Further analysis indicates that most of emissions from operational energy in a hot and dry climate are from cooling (40%) plus 7% for Fans and Blowers (Figs. 27, 28).