6. DISCUSSION:
Results indicate that most of the carbon emissions in a building are generated from operational energy and most of these are due to cooling and heating. Understanding the origin and quantity of these emissions will permit to better develop strategies to reduce them. These strategies also reduce energy use.
Figure 30 shows the percentages of emissions from all sources, including transportation, averaged for the four climate zones. This figure gives a very general idea of where the emissions that are directly related to buildings (construction, water, operation, waste) and indirectly related (transportation to and from the building) come from. Operation is the single largest direct contributor and transportation to and from the building is also very important but can vary widely.
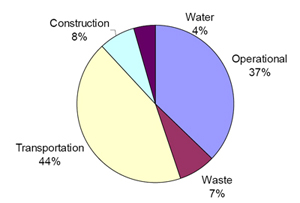
Figure 30: Average Distribution of Emissions including Transportation
If carbon emissions from transportation are not considered then of course, these percentages are modified and carbon emissions from operational energy have a much larger impact, about 66%.
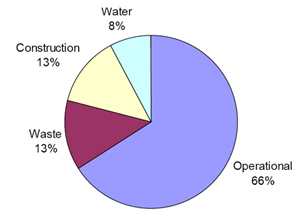
Figure 31: Average Distribution of Emissions averaged for the four climates using Design Builder and HEED (excludes transportation)
Energy used for heating and cooling is the biggest component of operational energy. Different graphs can be generated to express building performance as a function of CO2 emissions from operational energy in different climates. Design strategies such as passive cooling and heating can be implemented in buildings to reduce these emissions.
Figure 32 shows energy use for heating and cooling in the different climate zones. Charts like these could help identify types of climates.
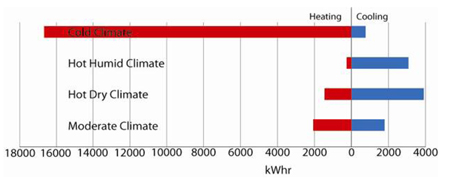
Figure 32: kWhrs from Heating and Cooling. Gas is used for heating and electricity for cooling.
Pie charts such as those presented in this paper can help define design strategies for specific climates. Depending of the distribution of the emissions in these charts, different strategies could be implemented to reduce these emissions. Table 6 includes the distribution of the emissions in the different climates. Operational energy constitutes the largest portion of the emissions in all climates and is most significant in the cold climate (59%) and least significant in the temperate climate (45%). The emissions from heating constitute the most significant factor in the cold (36%) climate while cooling is the most significant in the hot and dry climate (41%) and in the hot and humid (40%). In the temperate climate cooling and lights are the most significant, 19% each and appliances are significant sources.
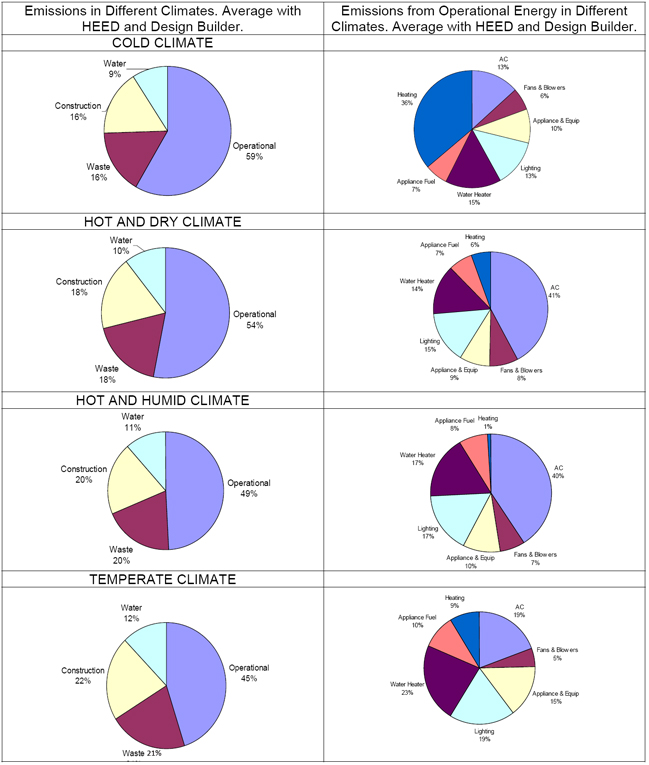
TABLE 6: DISTRIBUTION OF EMISSIONS IN DIFFERENT CLIMATES
7. CONCLUSIONS AND RECOMMENDATIONS:
Table 7 below provides an overview of the calculators that were examined during this exercise.
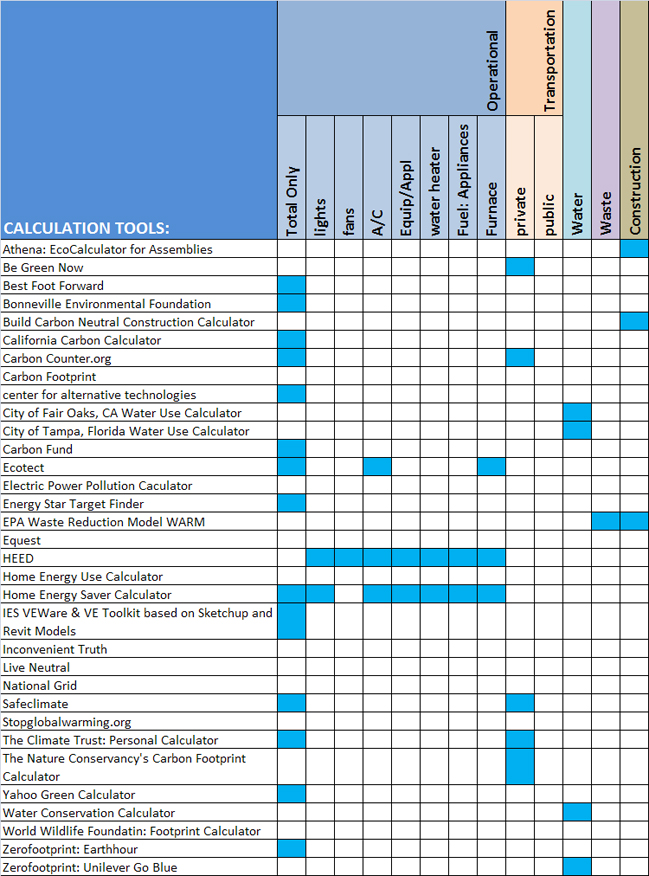
TABLE 7: COMPARISON OF CARBON COUNTING TOOLS
There are many carbon counting tools available but there is no single tool that permits to calculate all of the building related emissions. I propose a series of tools that can be used to determine emissions in residential buildings.
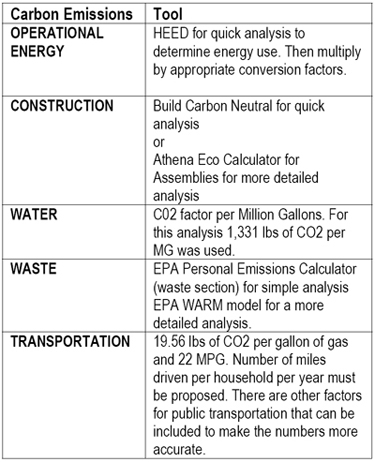
TABLE 7: RECOMMENDED TOOLS TO CALCULATE CARBON EMISSIONS IN RESIDENTIAL BUILDINGS
8. REFERENCES
(1) Terri M. Boake. The Leap to Zero Carbon: Defining the first steps to carbon neutral design. SBSE Retreat, 2008, New Forest UK.
(2) Nadav Malin. Counting Carbon: Understanding Carbon Footprints of Buildings, Environmental Building News, July 1, 2008.
(3) United Kingdom Department for Environment Food and Rural Affairs (DEFRA) fuel emission factors (July 2005)
(4) eGRID2006 Version 2.1 (April 2007)Summary Tables were used
(5) B. Bordass, from Solar Cities: the Fundamental Documents. S Roaf and R Gupta. With contributions from Dr Bill Bordass, Chiel Boonstra, Catherine Bottrill and Robert Cohen. An outcome of the meetings of the Carbon Counting Working Group
(6) Bryan H., Trusty W., Developing an Operational and Material CO2 calculation protocol for buildings. SB08 Melbourne, Australia.
(7) http://buildcarbonneutral.org/
(8) personal emissions calculator at http://www.epa.gov/climatechange/emissions/ind_calculator.html
(9) http://www.energy.ca.gov/2007publications/CEC-999-2007-008/CEC-999-2007-008.PDF
(10) http://www.fueleconomy.gov/Feg/co2.shtml
(11) Milne, Murray. A Design Tool for Meeting the 2030 Challenge: Measuring CO2, Passive Performance, and Site Use Intensity. American Solar Energy Association Conference 2007, Cleveland, Ohio.
9. ACKNOWLEDGMENTS
This research was partially supported by the SBSE Carbon Neutral Design Project and Energy Design Resources, which is funded by California utility customers and administered by Pacific Gas and Electric Company, Sacramento Municipal Utility District, San Diego Gas & Electric, Southern California Edison, and Southern California Gas under the auspices of the California Public Utilities Commission |