CND header

AIA Home > SBSE Home > Teaching Resources > Carbon Neutral Design > Carbon Neutral Teaching > Rashed-Ali - Climate Analysis

arrow Project Introduction

arrow What is Carbon Neutral Design?

arrow Carbon Neutral Design Process

arrow Carbon Neutral Design Strategies

arrow Carbon Calculation Protocols

arrow Carbon Calculation Tools

arrow Carbon Neutral Case Studies

arrow Carbon Neutral Teaching

Curriculum Projects Overview

Projects (by professor):

> Bagneid
> Boake
> Chalfoun
> Demers + Potvin
> Elzeyadi
> Guzowski
> Haglund
> Kaiser
> La Roche
> Peña
dot Rashed-Ali
Climate Analysis
Site Analysis
Assessment of Form Options
Solar Control
Daylighting
Whole Building Energy Use

> Stannard
> Theis
> Thomson

Projects (by teaching topic):
visit this link to see the projects sorted by the carbon related topic

> Frameworks and Goals
> Site
> Building Form / Integrated Design Overview
> Envelope
> Passive Strategies
> Efficient Mechanical Strategies
> Energy
> Materials
> Water
> Miscellaneous Related Topics
> Integrated Topics

arrow Resources

arrow Links

 
The Carbon Neutral Design Project:
Carbon Neutral Teaching: Curriculum Materials Development
Hazem Rashed-Ali
University of Texas, San Antonio

Graduate and Undergraduate Seminar Course
Intermediate and Senior Students

Climate Analysis

Climate Analysis

Design Performance Objective

Climate Analysis

The image represents part of the The image represents part of the climate analysis conducted for Indianapolis, IN. The bar graphs show a comparison between the percentage of hours in each month in which the indoor conditions will fall within the comfort zone boundaries using the passive strategies listed (red columns) vs. the same values without the passive strategies (yellow columns). A larger difference between the two indicates the higher potential for the selected combination of passive strategies in the climate being analyzed.

Student: Anish Joseph
Software / Tools:

The Weather Tool (Ecotect Add On)

Energy Plus Weather Data

Spring 2008 “Applications in Sustainable Design” Graduate/ Undergraduate Seminar

Climate Analysis

To conduct a detailed analysis of the local climate in the city/area in which the selected design project is located. Then use this analysis to identify the optimum passive design strategy or combination of strategies for the selected location.

course and project outline

Investigative Strategy

To identify and locate the climate data/file for the selected project location. Subsequently, to conduct an analysis of this climate using Square One’s Weather Tool. The analysis included the following:

1. Identification of the selected project site (city), the corresponding weather station, and the corresponding climate region from the Lechner climate classification (see Lechner: heating, Cooling, Lighting, design methods for architects)

2. Description of the different climate parameters for the selected location, supported by graphs, generated from the climate analysis tools that sufficiently describe these parameters especially their seasonal variations

3. Summary and discussion, based on the previous analysis, of the climate in the selected location with regard to the need for heating/cooling, the availability of natural resources (e.g. solar energy, rain, etc.), as well as any other conclusions you deem relevant.

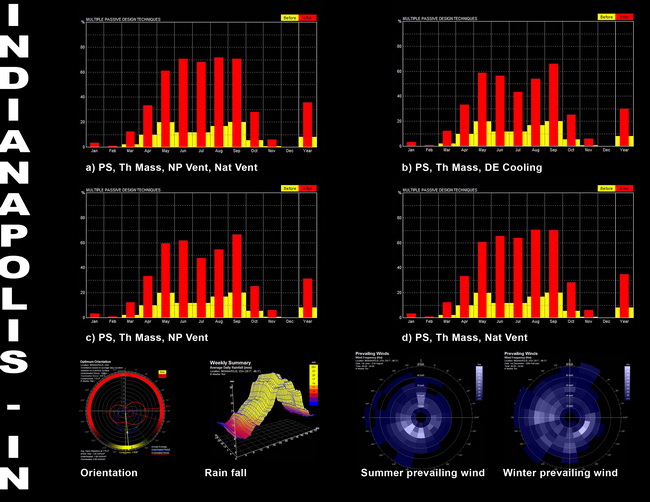
4. Analysis of the climatic design strategies (or combination of strategies) recommended for your site for each season (winter, summer, spring/fall) and for the year as a whole, supported by graphs from the analysis tool.

Evaluation Process

As described above, students were required to submit a report de scribing the analysis process and conclusions with regard to the most effective passive design strategy/combination of strategies. Conclusions for each city were evaluated by the instructor and discussed in class.

Evaluative Criteria

The evaluation was based on the following:
- Conducting the climate analysis for the required parameters.
- The depth of the discussion of the implication of the resulting climate characteristics with regard to the building(s) performance.
- The appropriateness of the identified combination of passive design strategies to the location, their potential effectiveness (as measured by the bar graphs), and the discussion of the relationship between the characteristics of the climate and the selected design strategies.

Cautions - Possible Confusions
While weather data are available online in a variety of formats, the Weather Tool only accepts a limited number of these formats. The Weather tool however does accept .EPW weather files (freely available from the Energy Plus website listed below). Once opened in the Weather Tool, the files should be saved in .WEA format.

If a weather file cannot be located for the target city, the closest city with similar conditions and with available weather data can be used. Possible variables to take into account include altitude, topography, and distance from large water bodies.

Range of Applicability in terms of CLIMATE
ALL
Range of Applicability in terms of TYPE
ALL
Reference Material
US Department of Energy, 2009, Energy Plus Weather Data. Available at: http://apps1.eere.energy.gov/buildings/energyplus/cfm/r_data.cfm
Duration of Exercise
One week.
Degree of Difficulty / Previous Knowledge Required
Performing the analysis involves minimal difficulty. Interpretation of the climate analysis information is more difficult and required both an initial presentation/discussion of the topic and then discussion and analysis of samples from the resulting student work in class. Previous knowledge of the principles of climate responsive design and basic passive design strategies was very helpful.


©2012 American Institute of Architects | Society of Building Science Educators | Legal Disclaimer